Subject learning objective
Learners can:
formulate the rules of
construction and
construct graphics of
functions
Subject Programme
Student will:
- understand the properties of quadratic functions (domain, range, maximum/minimum values, function zeros) and be able to sketch their graphs;
- use quadratic functions to model real-life situations
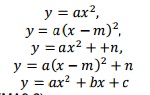
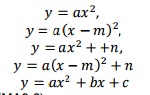
- understand how the coefficients a, b, c of a quadratic

influence the shape and position of the curve;
 or
or 
where a is not zero.
Suggested teaching activities
- Introduce unit by showing an equation to discuss
for example

and ask what learners notice, then ask what type of equation is it?
- Show by expansion that quadratic
- Recall work done in unit quadratic equations:
- finding factors of quadratics solving by completing the square solving by formula
- Challenge learners to solve a quadratic, choosing an appropriate method from those already encountered.
- Can anyone remember the type of graph that a quadratic produces?
- Ask learners to make a quick rough sketch and show each other, and discuss.
- Remind learners that this type of curve is a parabola, and it is one of the conic sections.
- This unit will allow a detailed examination of this curve.
- Start by asking learners to sketch the graph of

Is this quadratic? What are the values of a, b, c?
- Model the creation of a table of values, selection
of scale on axes, plotting points, sketching the
curve
- Working with a partner, discuss the observable features and relate these to the equation: symmetry relation to
- y – axis
- relation to x – axis
- Where the curve changes direction
- We understand the general form of the quadratic:

- Ask learners to predict what will happen if we
change a, b or c
How would we check the effects of changes?
How many graphs would we need to confirm our
thinking?
Learners work as a group, deciding what to
investigate, dividing the tasks between them,
discussing findings, and preparing a
presentation for other groups.
- Hopefully, the following discoveries will be made:
- The coefficient of x squared (a)
- affects the shape of the curve (gradient) with
higher coefficient producing a ‘tighter’ curve
closer to the y-axis
- where a=0, the curve is a straight line (if b=0
as well, it is horizontal)
- negative coefficients invert the curve
3. The constant moves the curve up or down, and
sets the point where the curve intercepts the y –
axis.
- Note the combined effect of all three: does this mean we can predict the curve of

Use the interactive graphing software to
examine the roots of quadratics – where the
curve intercepts the x-axis produces two roots,
where the curve touches the x axis at one point there is one root, curves which do not meet the x
axis have no real roots
- Learners to discuss in pairs what that means
about the discriminant for these curves
Make a free website with Yola